A D J A C E N C Y optimizing spatial adjacencies using evolutionary parametric tools

This project implemnts parametric modeling software as an analytical tool to graphically represent and optimize the adjacency requirements in programmatic spaces. The resulting three-dimensional spatial diagrams are evaluated based on evolutionary fitness, which within this research context is defined as minimizing the numerical value of the total distance of all interconnected programmatic elements. This approach offers a unique system of analysis that can create an extensive range of otherwise unexplored solutions to space planning when faced with complex adjacency requirements and a large number of programmatic elements. The Grasshopper script is a significant leap forward over existing research in this area, with the ability for users to define an irregular shaped site boundary, input multiple stories, relate program elements to external adjacencies (views, parking, etc.) and handle an unlimited number of program elements. Consequently, the resulting script can be used as an aid in the schematic design of buildings that have inherently complex programmatic relationships.
The focus involved developing a parametric definition that would automatically arrange spatial volumes. These volumes represent the various building functions (programs) in terms of dedicated square footage. The driving condition for these experiments is adjacency. The theory is that if two functions in a building need to be connected, they should be adjacent to one another. The degree of adjacency is here viewed as the distance between the centeroid points of related programmatic volumes. The relationship between programs is scored as a numerical value, the lower the value, the closer the programs, the better the score.
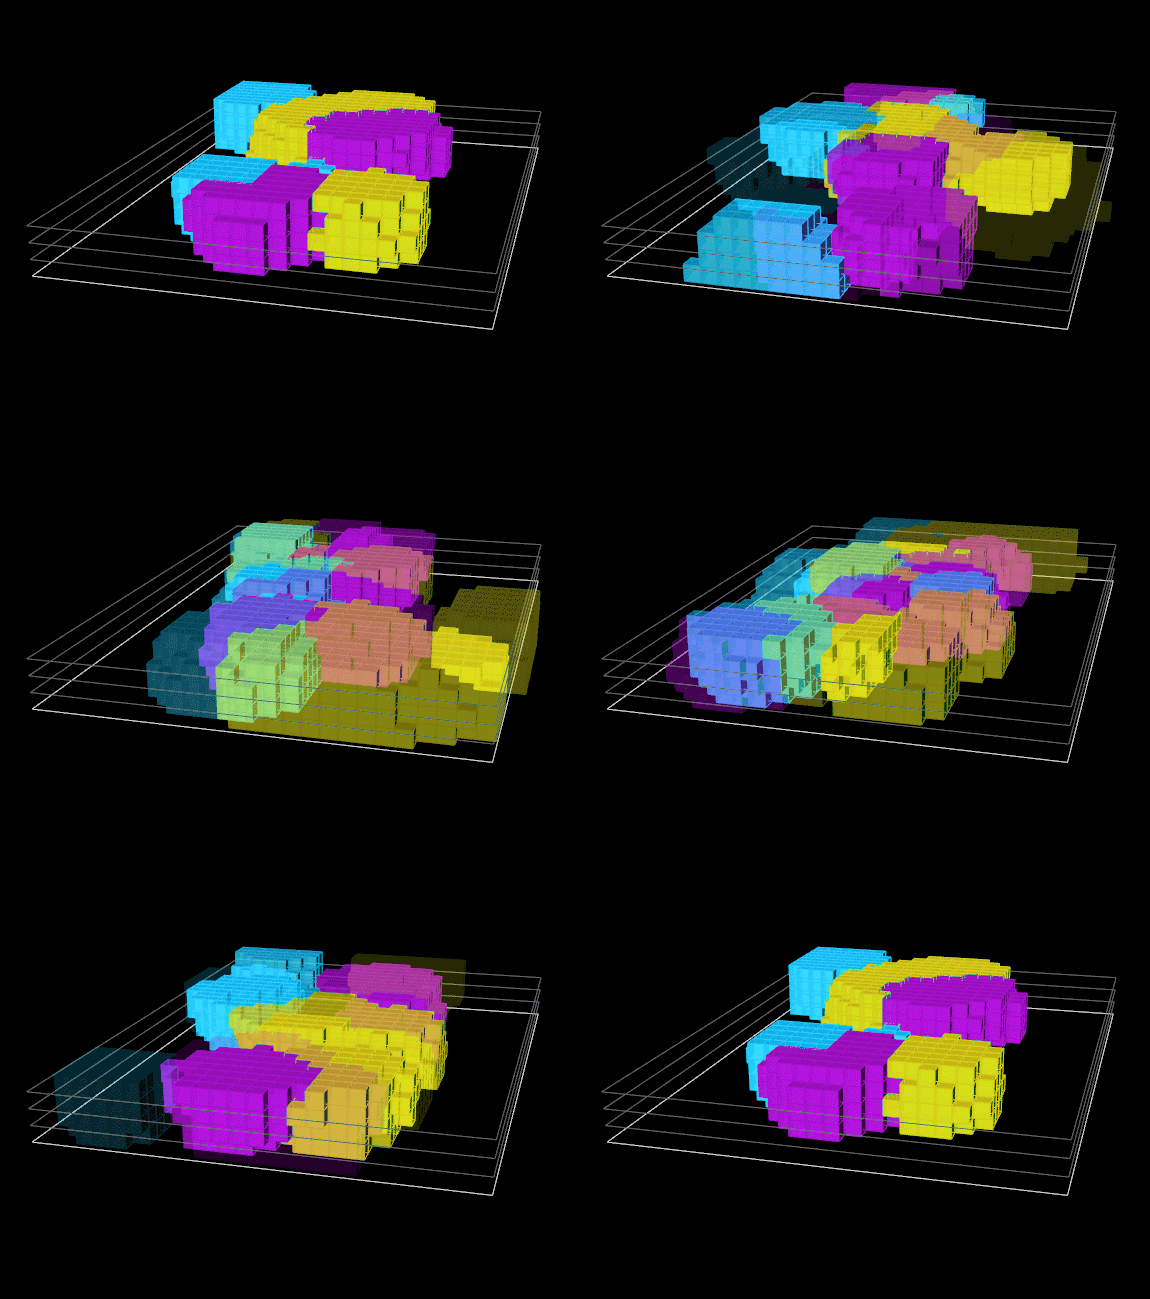
The resulting model contains all programs, arranged within a larger volumetric container. This container represents the building shell. Each arrangement represents an ‘individual’ iteration. The tool will automatically create individuals and store their information in groups or ‘generations’. The evolutionary process improves the proximity score over the course of many generations. The resulting diagrams produced autonomously by the computer are sorted, and the fittest results can be examined and refined in sharp contrast to less fit ones, informing the design process. This type of algorithmic approach can offer a greater scope of design exploration in a shorter time than otherwise conventionally possible.
architectural technology graduate research
in association with
Portland State University :
Corey Griffin, Sergio Palleroni, Huafen Hu,
Lyee Chong, Benjamin Deines.
Zimmer Gunsul Frasca Architects :
Nicholas Papaefthimiou, Jonah Ross, Kip Storey.
Software :
Rhinoceros NURBS Modeling
Plug-ins : Grasshopper + Galapagos
Publication :
Perkins + Will Research Journal Vol. 07.02
Special Issue : Future of Architectural Research


evolutionary parametric definition

a
b
c
d
f
e
a
_establish site specific initial geometry
The process begins with a user created, two dimensional closed loop line, representing a theoretical site boundary. This is the only geometry not parametrically generated. There are also customizable settings for the user to set up a grid within that line, dictating the shape and size of cells .To account for multiple storeys the grid can be offset vertically any number of times, floor to floor height is adjustable. If some storeys are differently shaped, the user can also manually draw the offset lines. The resulting grid cells are all marked at their central point, this group becomes the point cloud; a pool of genetic possibilities for the model.


b
_set individual origin locations
The various program elements are 'grown' within the grid outward from central origin points. Their position can be any single available point in the established cloud. The list of individual origin points in a generation represents the genome pool for the evolving model.

_assign hierarchy with list order
When optimizing ajacency it is likely that certain building functions are more important than others. The list of program elements must be arranged in order of importance. When assigning space within the model, The first element dominates the second, which dominates the third and so on. The second element can only occupy space left over after the first has claimed it's own.

1
2
3
4

_assign square footage to programs
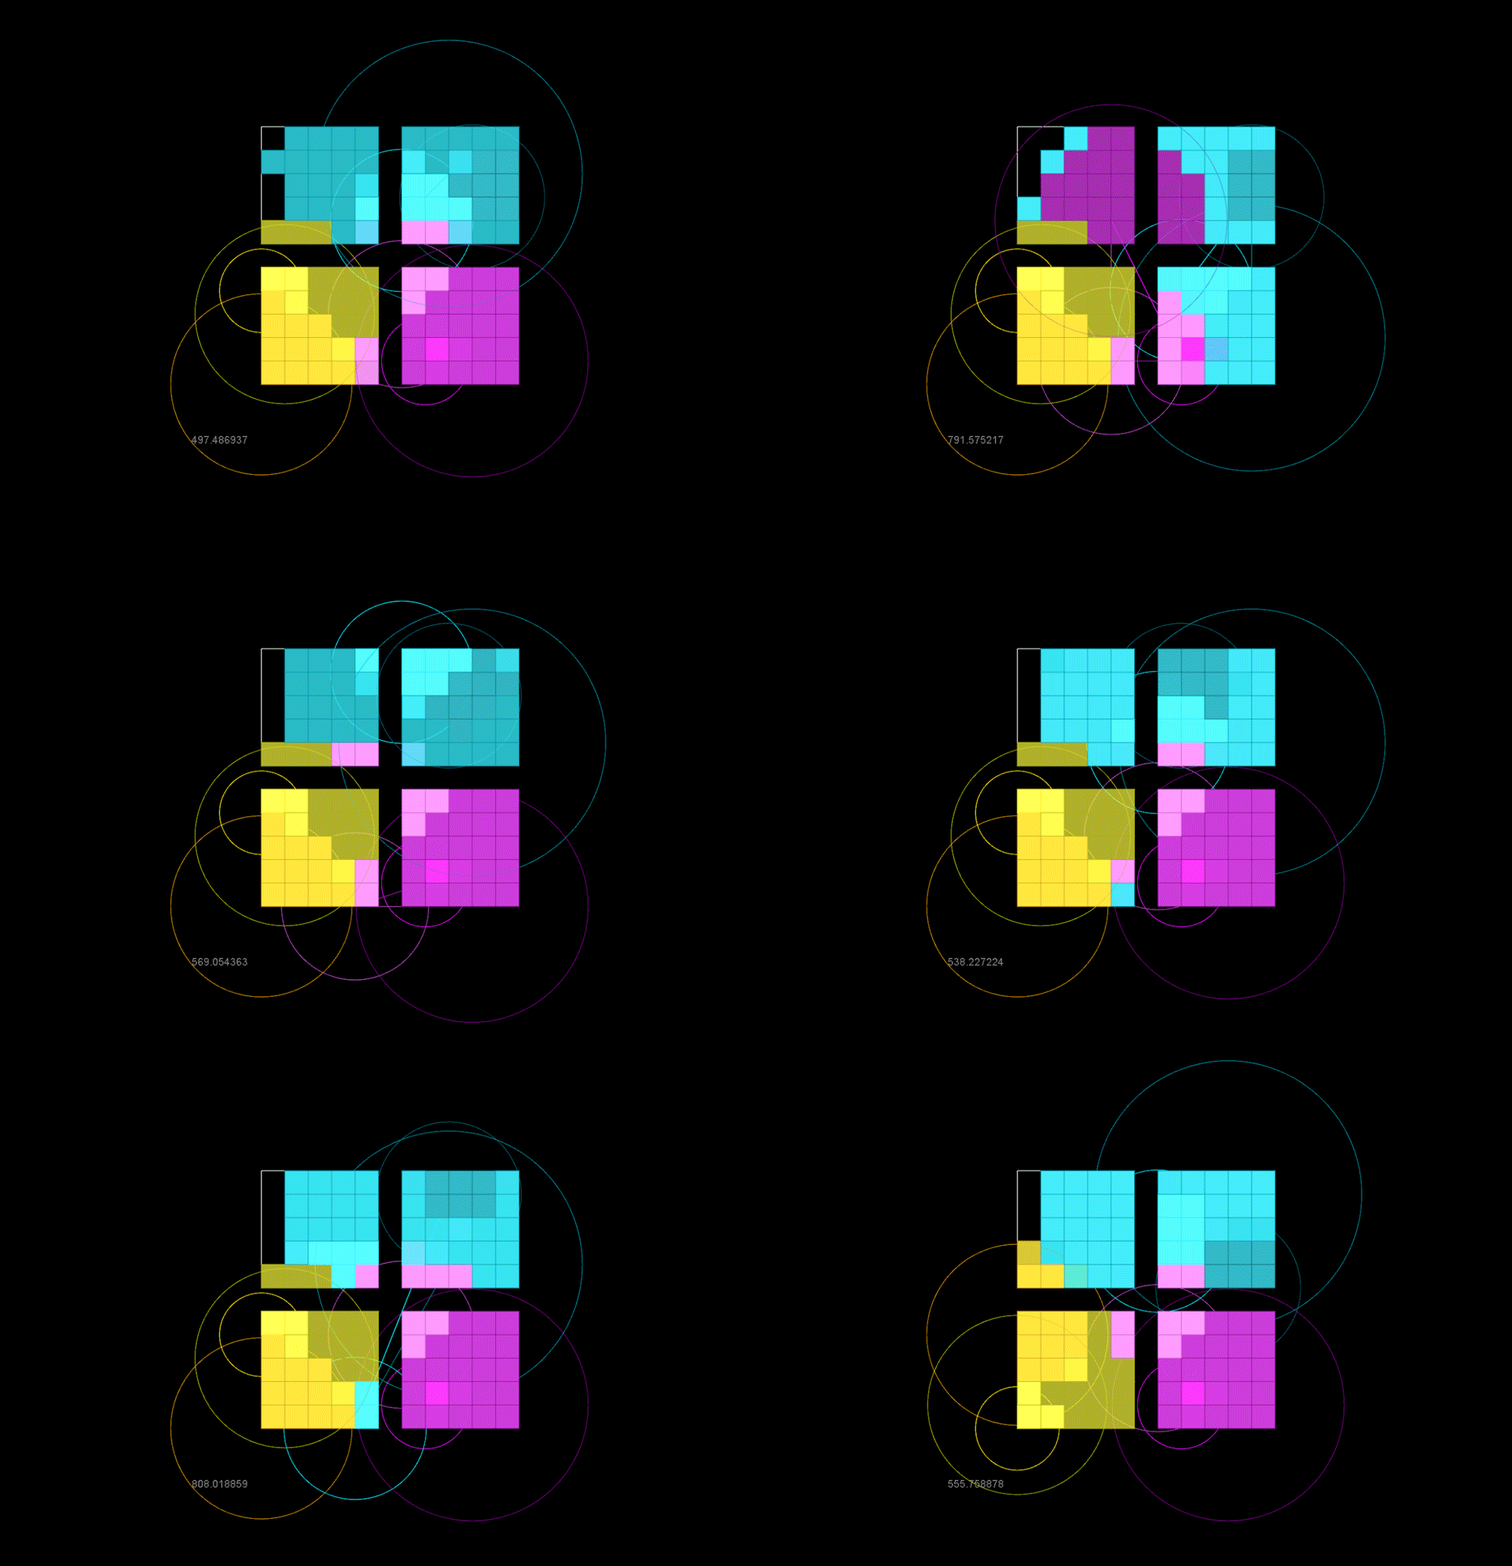
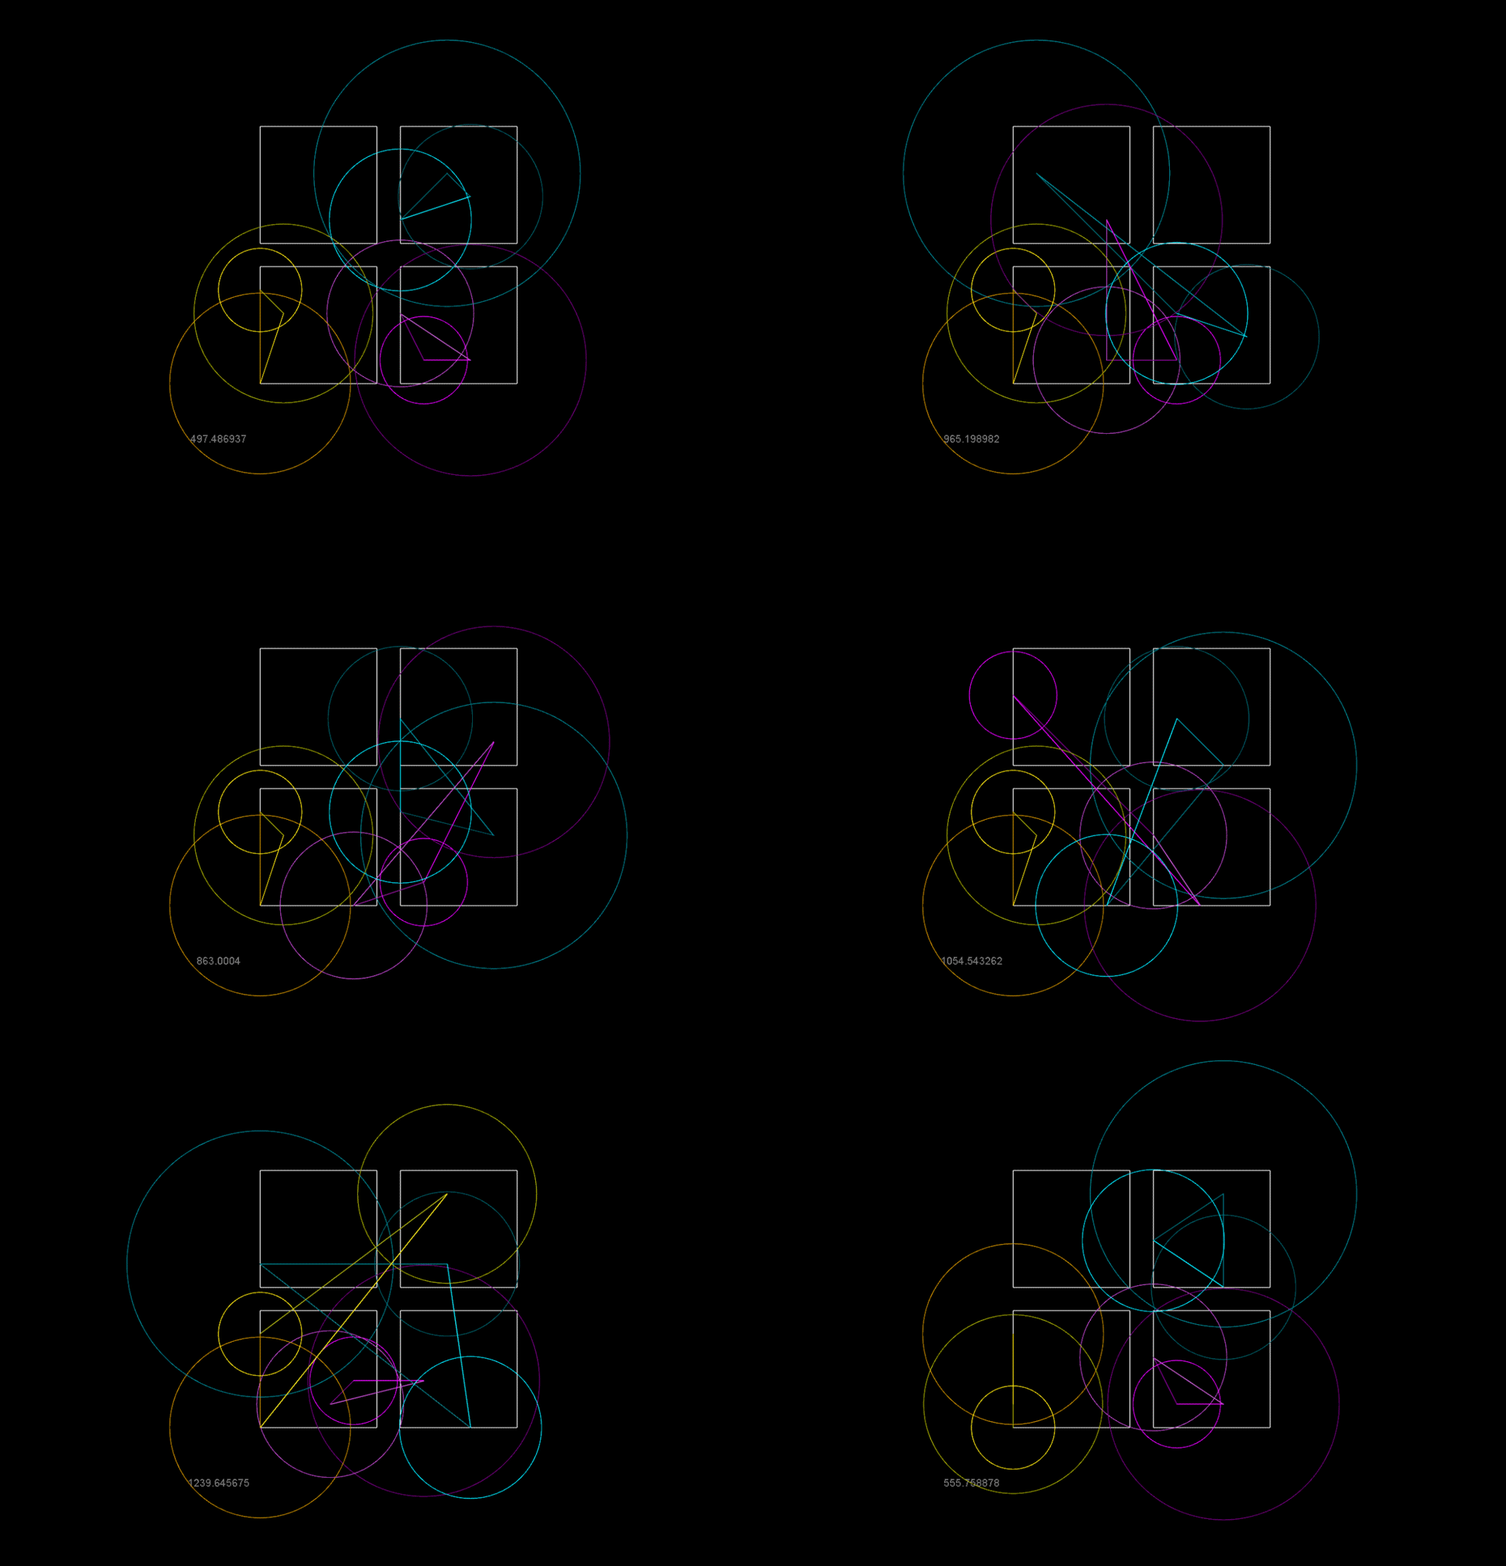
The floor area of each programmatic element is manually input. Starting at the origin point, each program will occupy the nearest available cells in all directions x, y, and z, until it has claimed the designated amount of floor space. The fill-in pattern can also be restricted vertically if desired. The circles in the diagrams represent the total floor space assigned around each origin point, in plan orientation.


c
_create lines between related origins
A line connecting origin points is established for every adjacency requirement combination. These lines are the visualized distance between related origins. Individual lines can have different levels of importance so any can be multiplied by an appropriate factor to weight their impact on the fitness value. A lower value is equivalent to a shorter distance between, and more favorable adjacency conditions. These individual values are mass added and the resulting number is the fitness score. The evolutionary goal is minimization of the fitness score.


d
_visualize
The last step in each generation is to project and color the actual volumes in the model. This part of the definition fills in the grid blocks and creates pipes around lines for rendering. The fitness score is also flattened and tagged in this stage.

e
_evolve generations
The evolutionary modeling process requires a set of variable parametric components, called the genome. Here the genome is made up of all the origin point selectors, which control the location of each individual. Each generation is automatically rearranged. The model also requires a way to measure each geneation's fitness in order to evolve constructively. The fitness here is the sum of the distances of the lines described in step C. The first generations are completely random,but as the process continues, the system will close in on favorable genetic combinations and eliminate unfavorable ones. Mutations also occur at a controlled frequency.


f
_animate recorded geometry
It is critical to to capture and communicate the evolutionary process somehow. This cluster allows the creator to look back through the iterations in chronological order.


